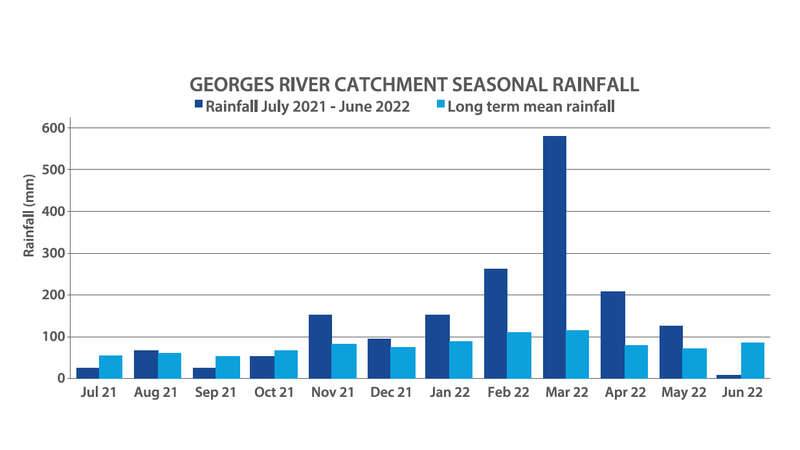
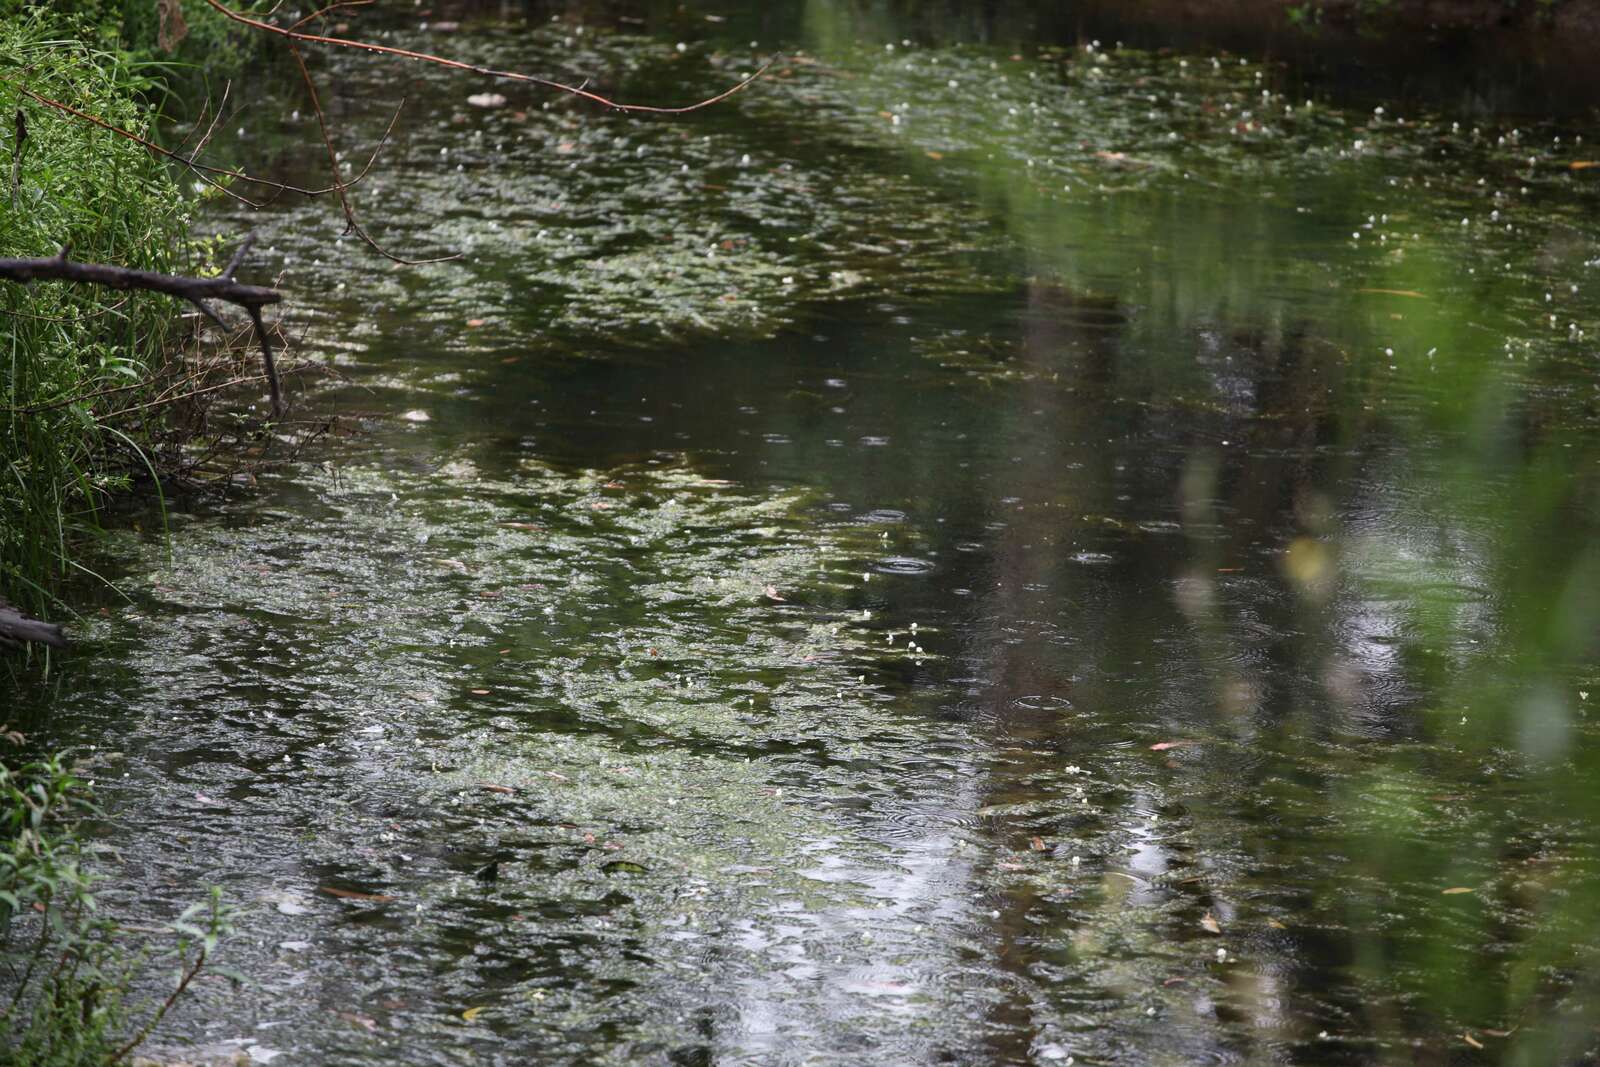
The amount of rainfall in 2021/2022 across the Georges River catchment was extreme. The graph below clearly shows the increase in rainfall this year, compared to the average rainfall, dating back to 1887. This unusual and abnormally frequent wetter period of flooding and higher than average rainfall during this time, throughout the Georges River catchment, has had a profound effect on the Georges River and its tributaries. Flooding generally has a deleterious effect on waterways causing increased contaminants, erosion and sediments flowing into the freshwater and estuarine environments.
The flooding and frequent rainfall events across the Georges River catchment this year has impacted the grades and may have skewed the results. Overall, the Freshwater Grades were positively impacted, meaning the water quality is ‘Fair’.
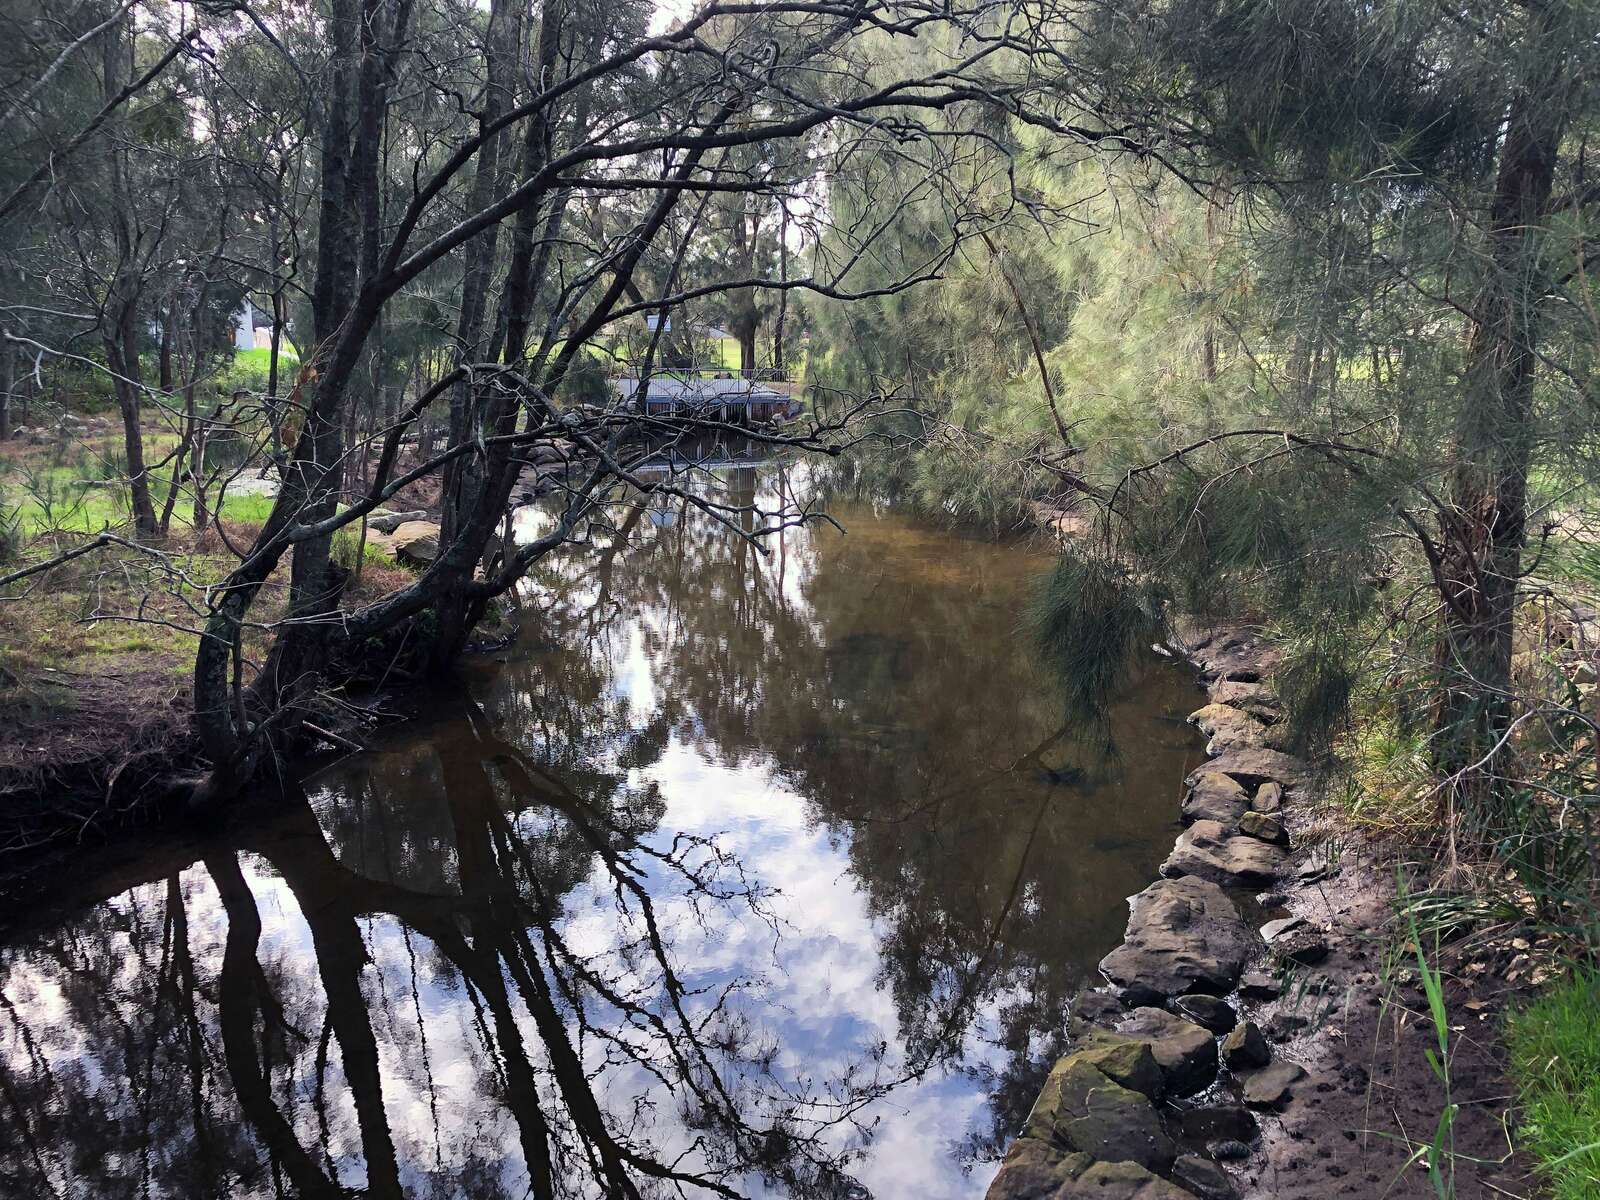
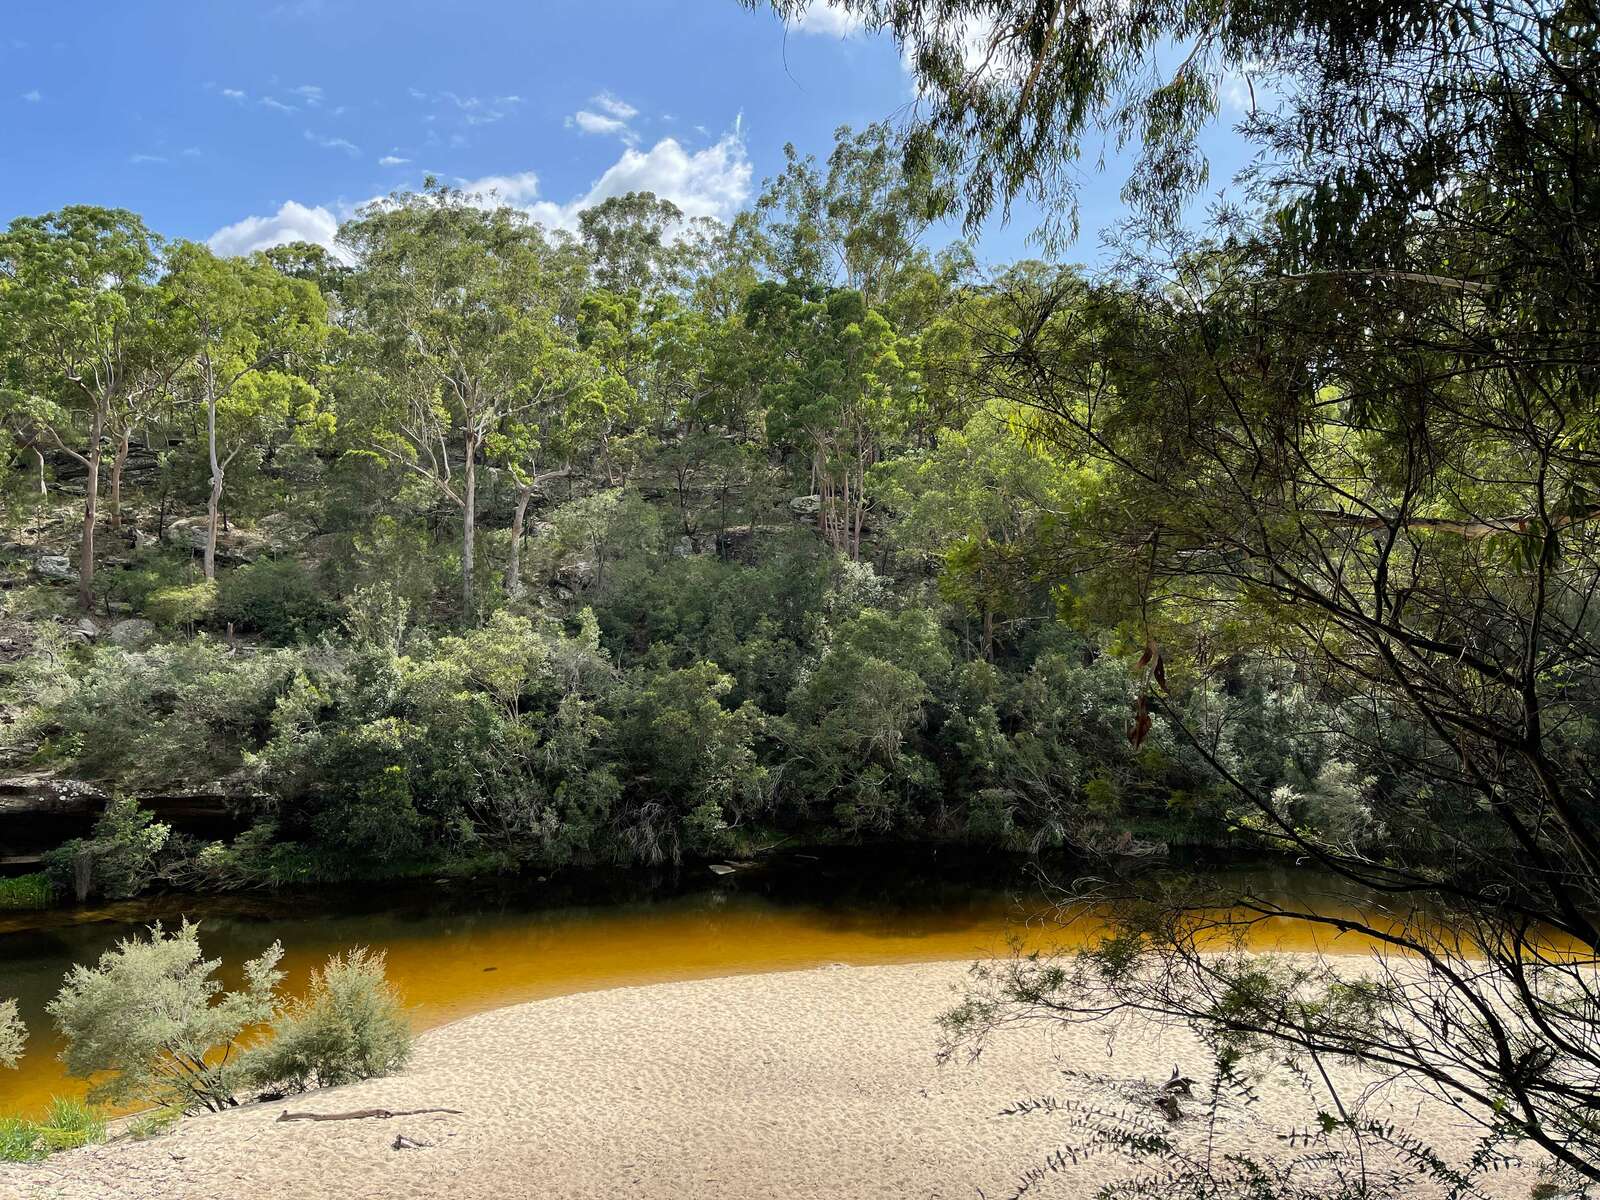
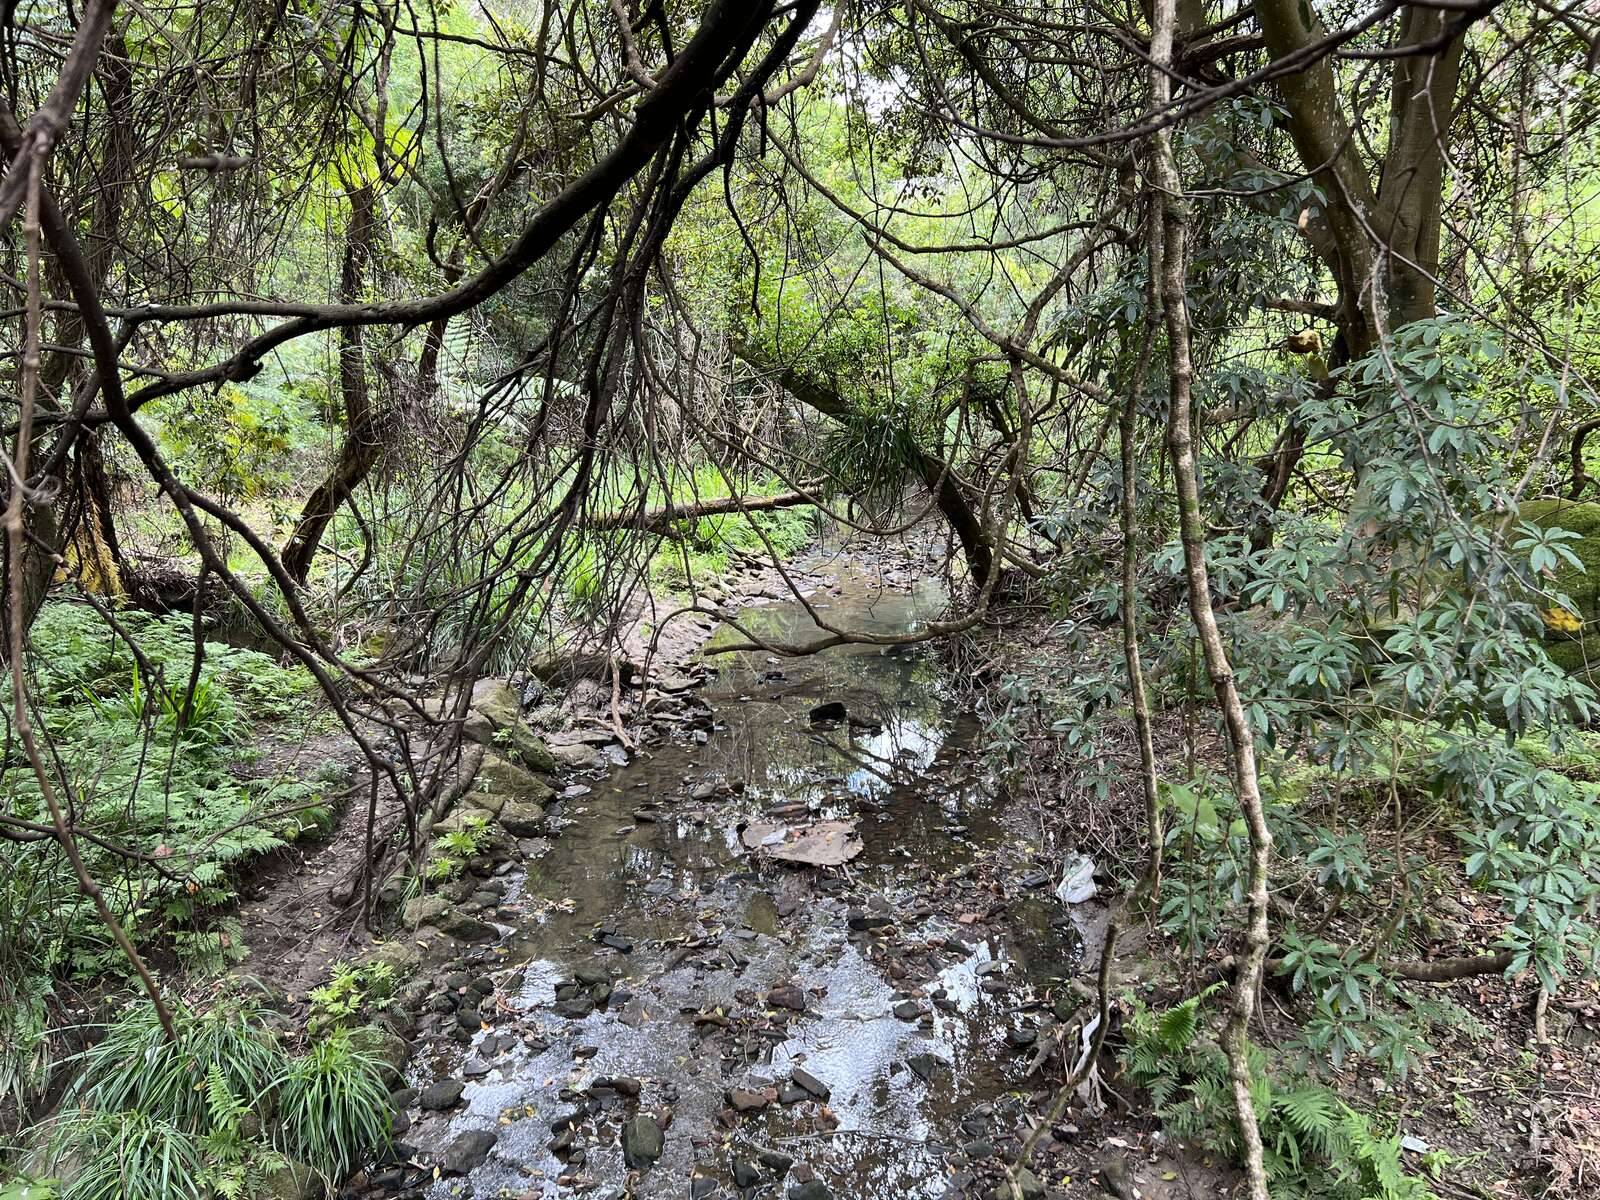
Surprisingly, the more pristine bushland subcatchments at the headwaters were negatively impacted with some of their grades reduced from ‘Excellent’ to ‘Good’.
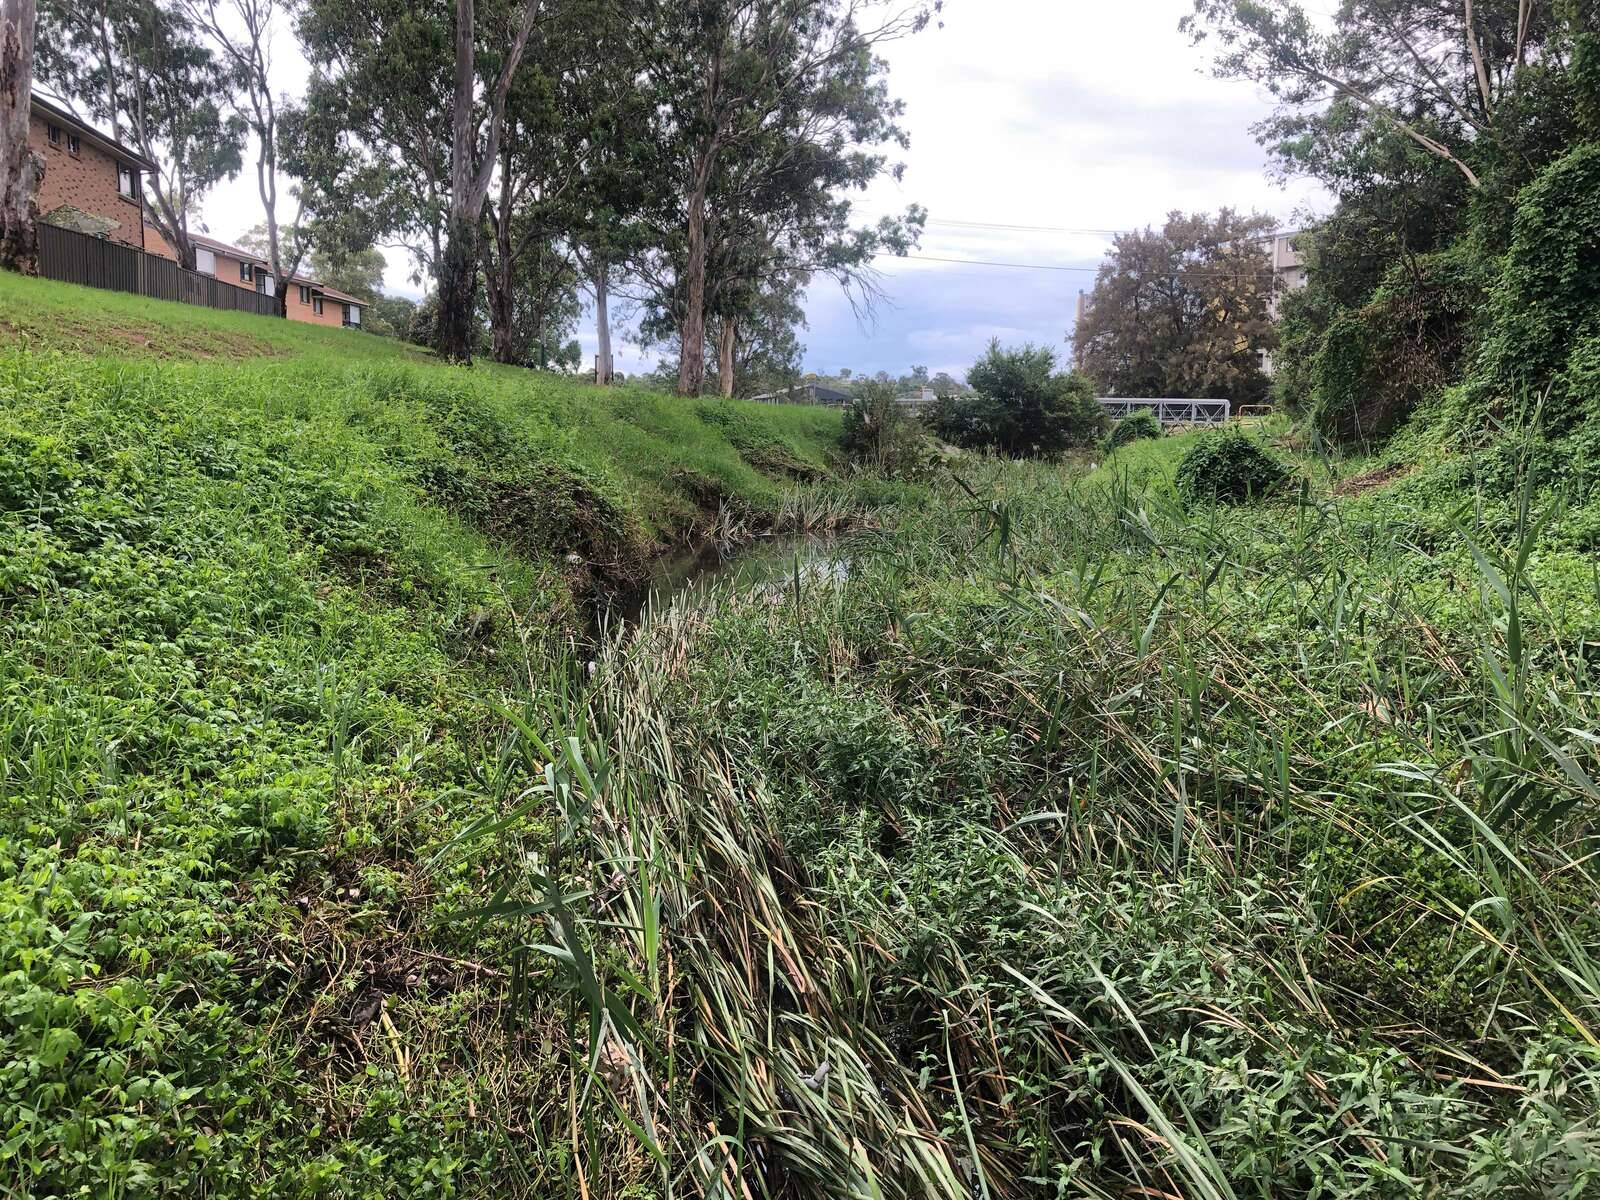
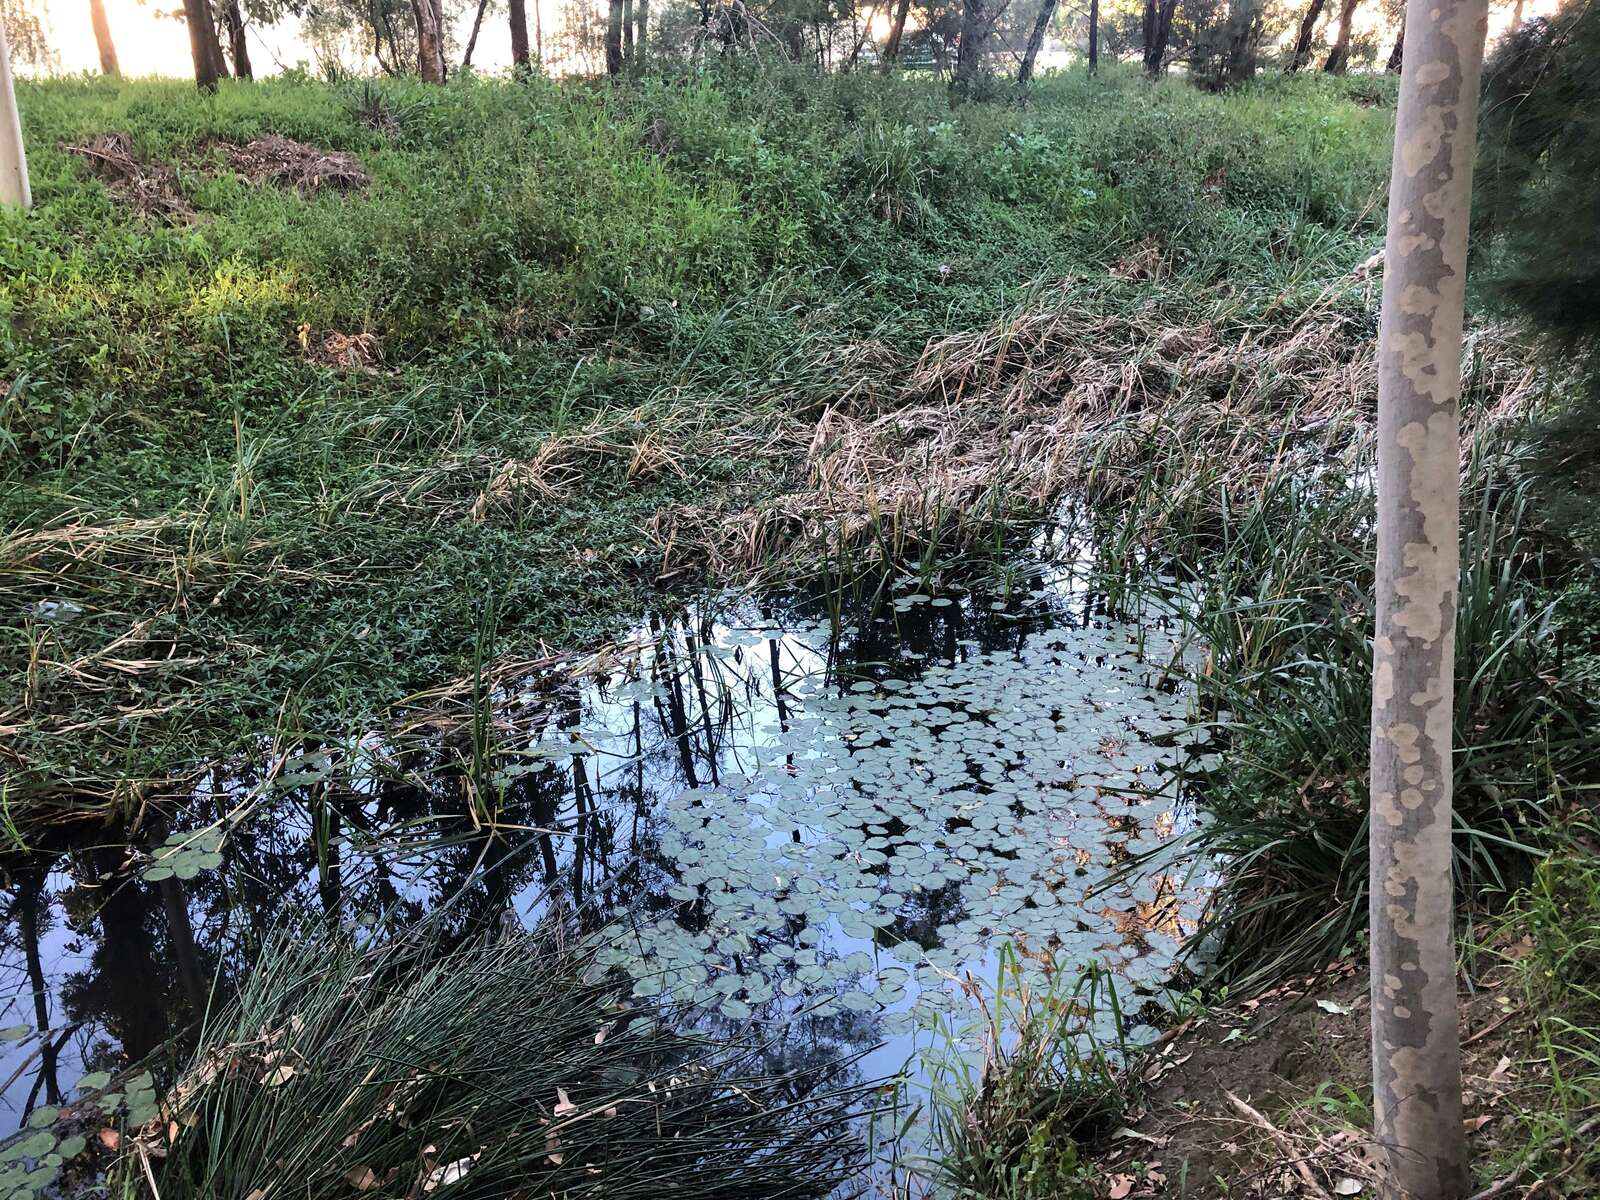
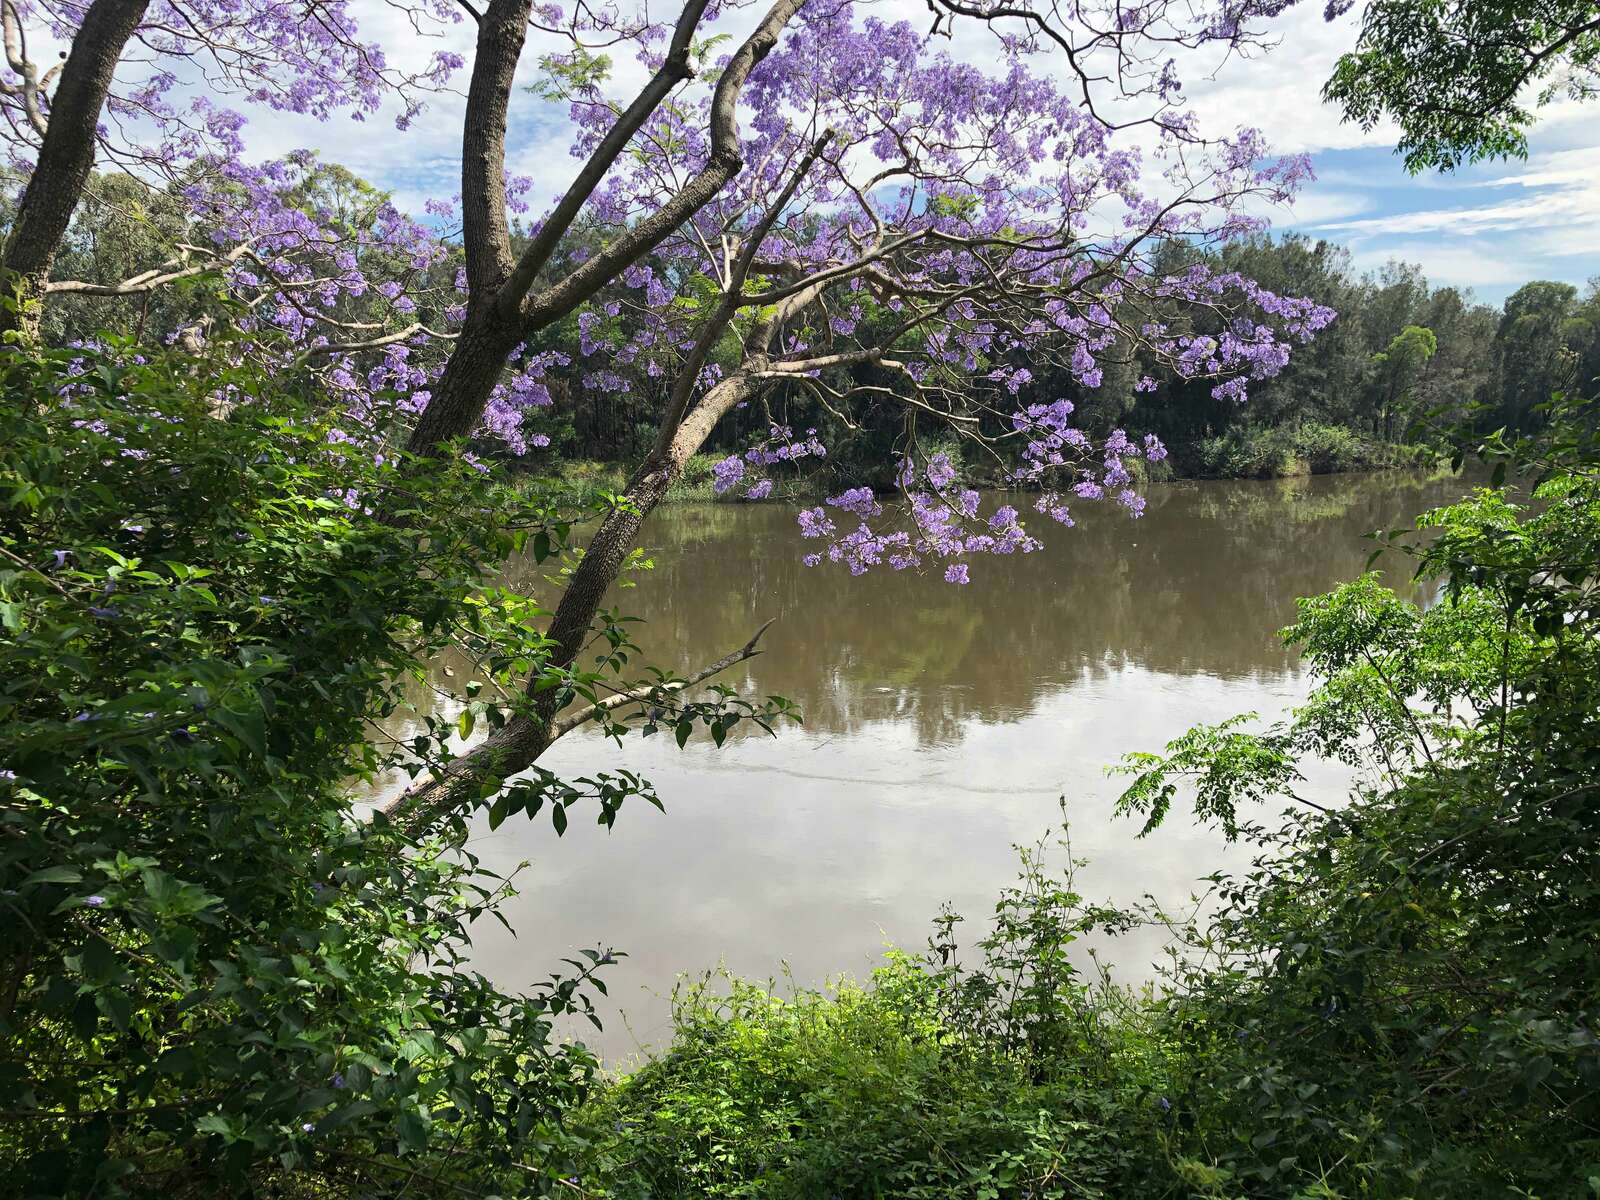
Conversely, some of the urban subcatchments, such as Prospect Creek, improved their grade from ‘Poor’ to ‘Fair’.
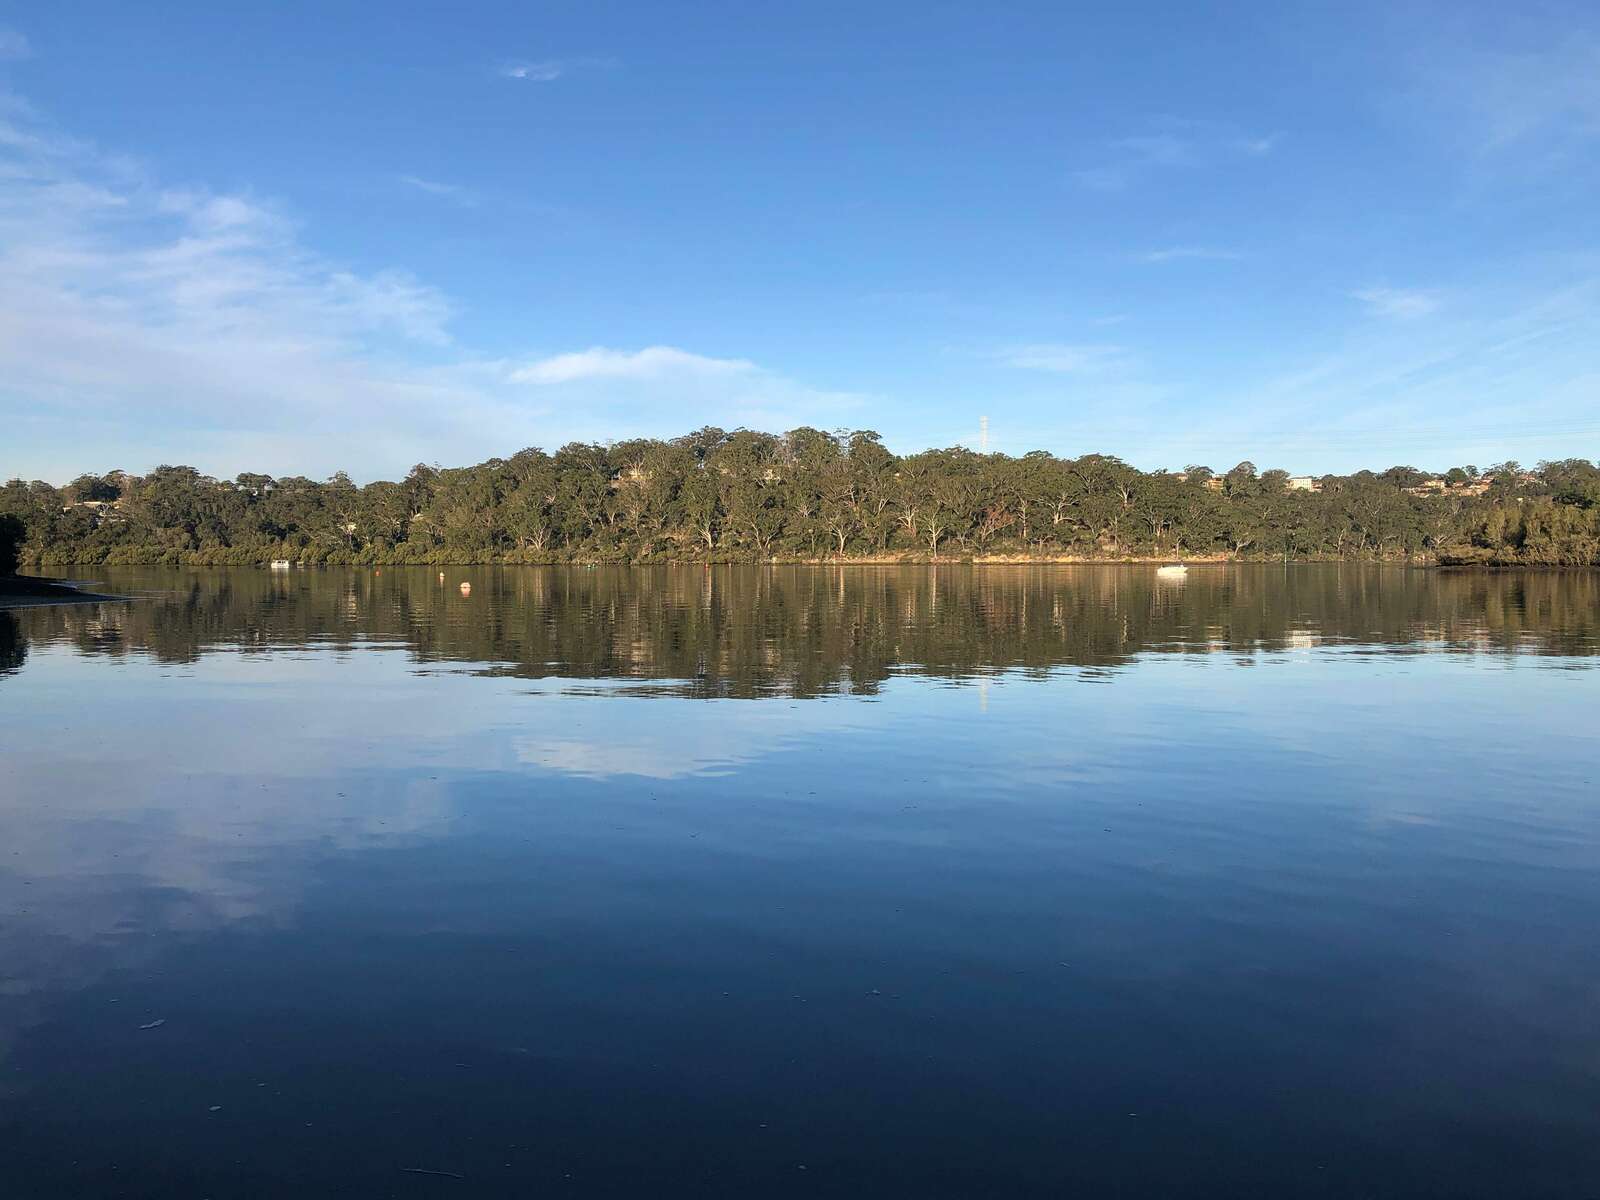
Overall, the Estuary Grade was ‘Fair’, dropping a grade since 2019/2020. This was probably caused by an increase in pollutants and nutrients being flushed from the urbanised area and entering the estuarine environments due to flooding and frequent rainfall events.
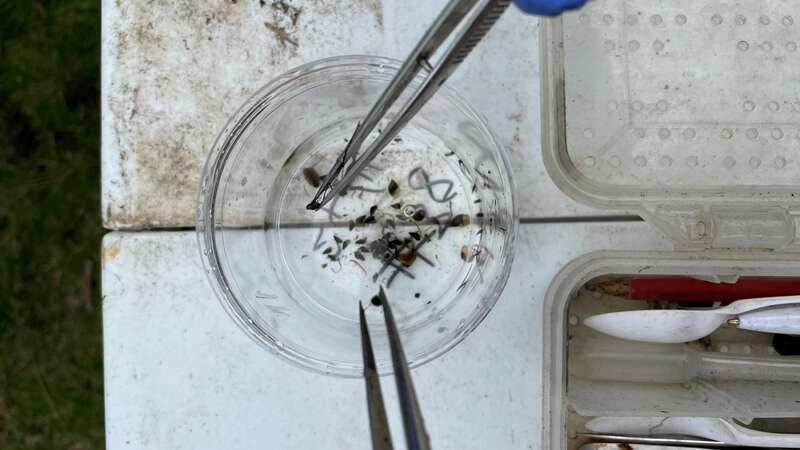
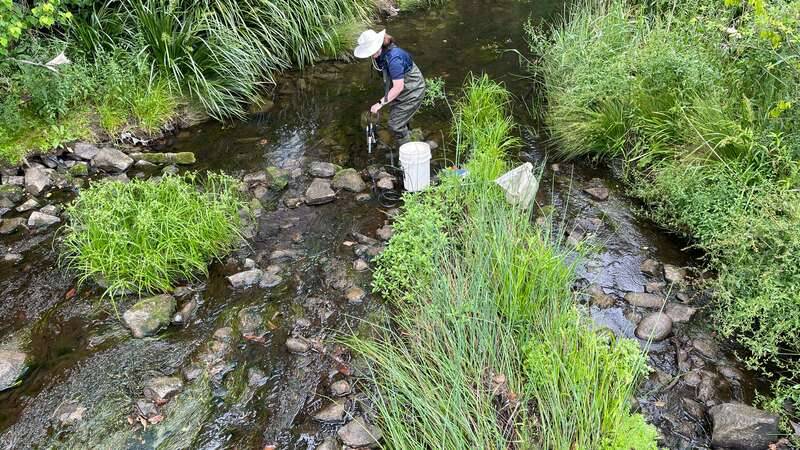
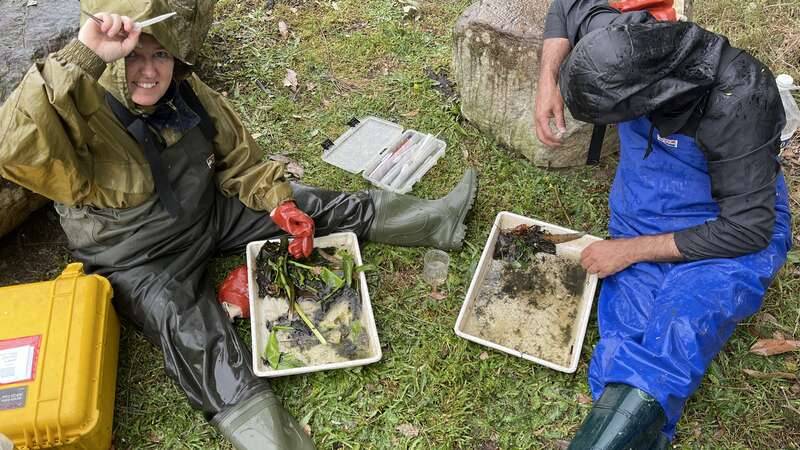
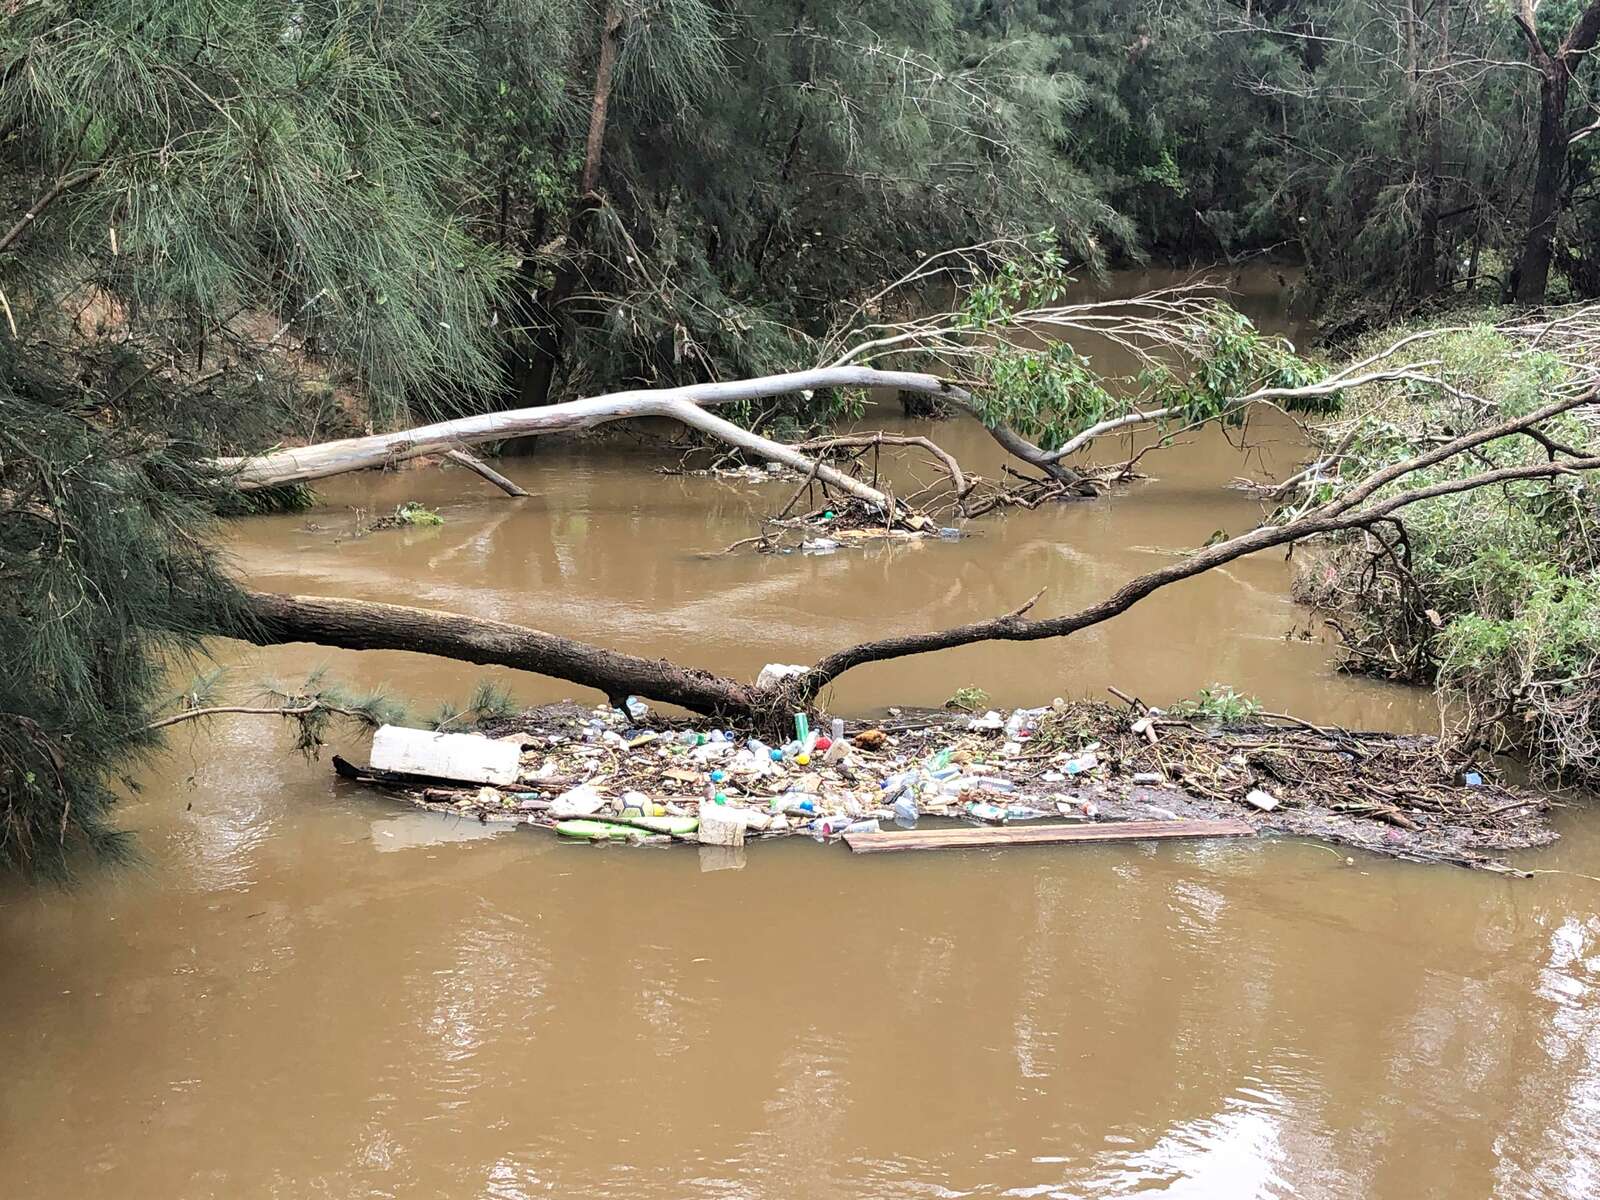
Floods and frequent rainfall events cause more sediment, pollutant and nutrient loads being washed from the heavily urbanised catchments and into the waterways. This contributes to lower diversity and abundance of aquatic macroinvertebrates.
Macroinvertebrates can be washed downstream, and populations and habitat can be smothered and degraded by increased sediment loads from excessive erosion and declining water quality. Macroinvertebrate families are temporarily eliminated from some systems during floods, and this may explain the decrease in grades across the bushland subcatchments this year.
Although an expected outcome of flooding and higher than usual rainfall is usually reduced water quality, this year’s results, in some of the urbanised areas, are an improvement on the previous records from 2019/20. These improvements in water quality in urban areas may be due to flushing of the Georges River system and purging the catchment by diluting the urbanised pollutants and nutrient loads in those local tributaries.
More than likely, the improved riparian habitats, continuous litter collection, increasing installation of gross pollutant traps and, at the time, reduced community activity during the COVID-19 Greater Sydney Lockdowns, may have help deliver a better result for urbanised areas this year. This is exciting news (not including the COVID-19 Greater Sydney Lockdowns) and should encourage our Member Councils to continue their good work. Litter reduction and bush regeneration has feasibly improved water quality in some urban areas in 2021/2022.
How are the grades calculated?
River health indicators are assessed against environmental guidelines allowing the award of a grade between A+ and F-. A+ is an ‘Excellent’ grade, A to B+ is a ‘Good’ grade, B to C- is a ‘Fair’ grade, and D+ to F- is a ‘Poor’ grade.
The three main indicators that help determine the grade for freshwater tributaries are: riparian (riverside) vegetation, water quality and freshwater macroinvertebrates. Grades in the main estuary are determined by the assessment of water quality only.
Grading is calculated for each subcatchment of the Georges River catchment. The Georges River catchment can be broken up into smaller regions known as subcatchments. A subcatchment is a distinct local area where all the water flows to the same network of waterways.
Read on for a summary of river health grades for 2021-2022 for each local government area (LGA), explaining which subcatchment the LGA is located in.
Bayside
Georges River Estuary and Lower Estuary subcatchment
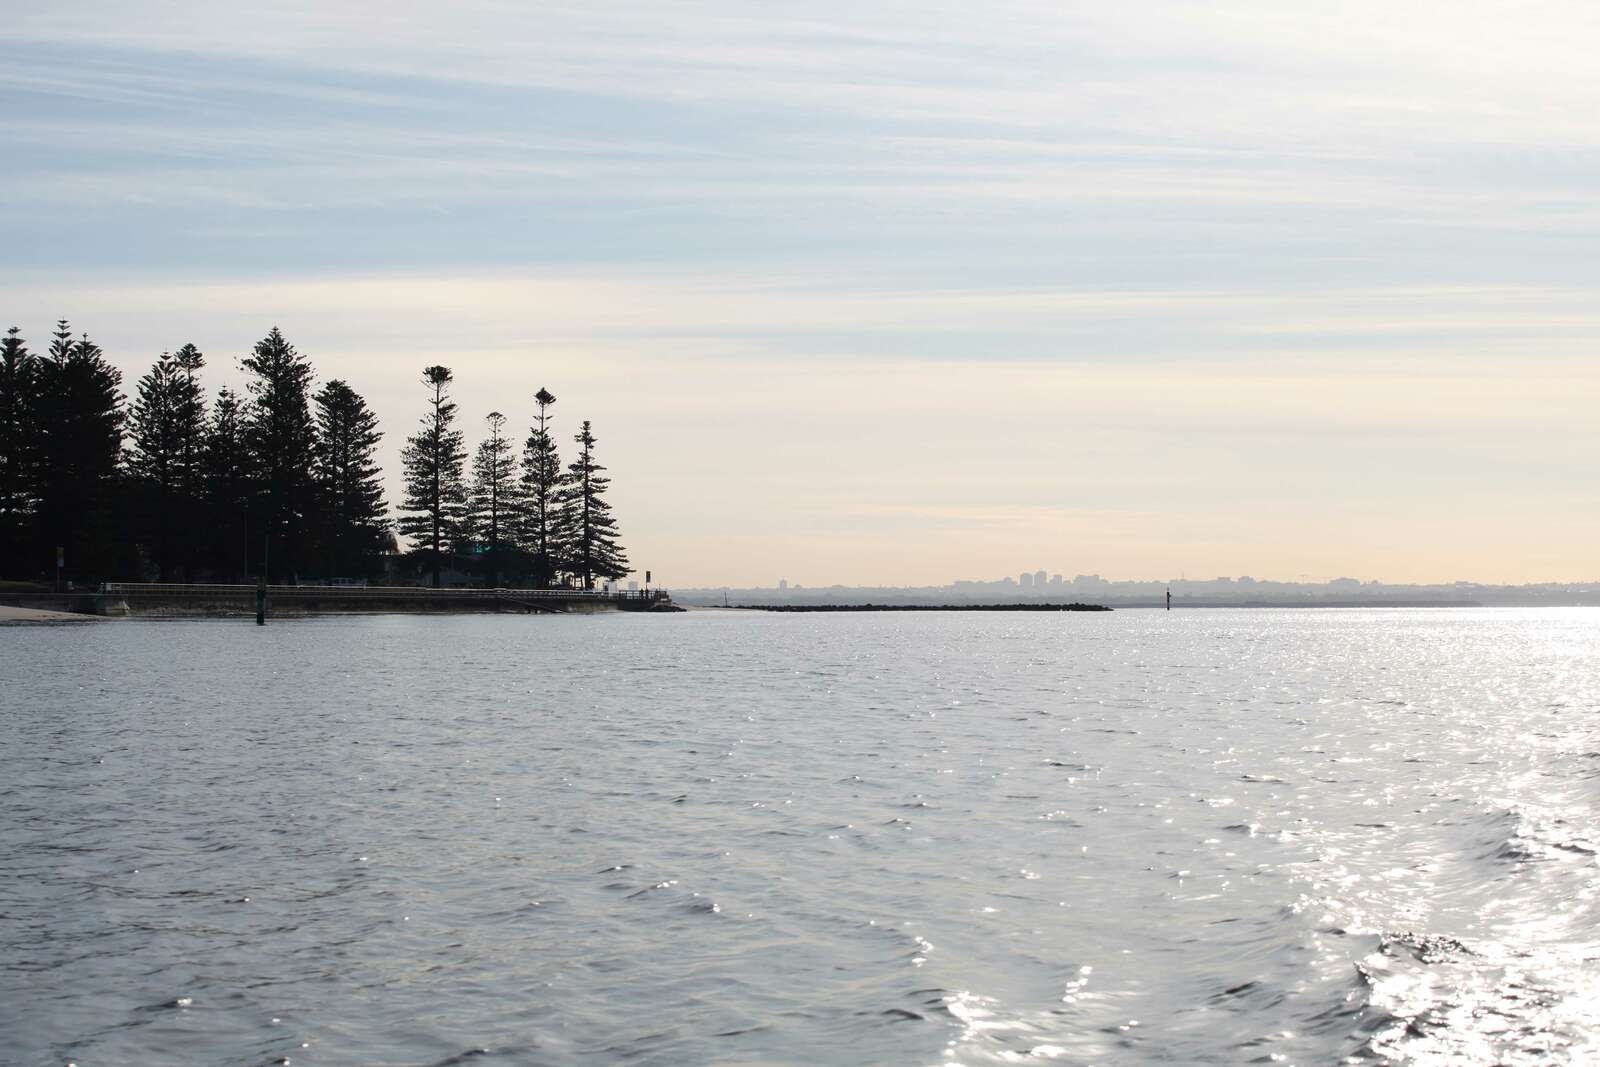
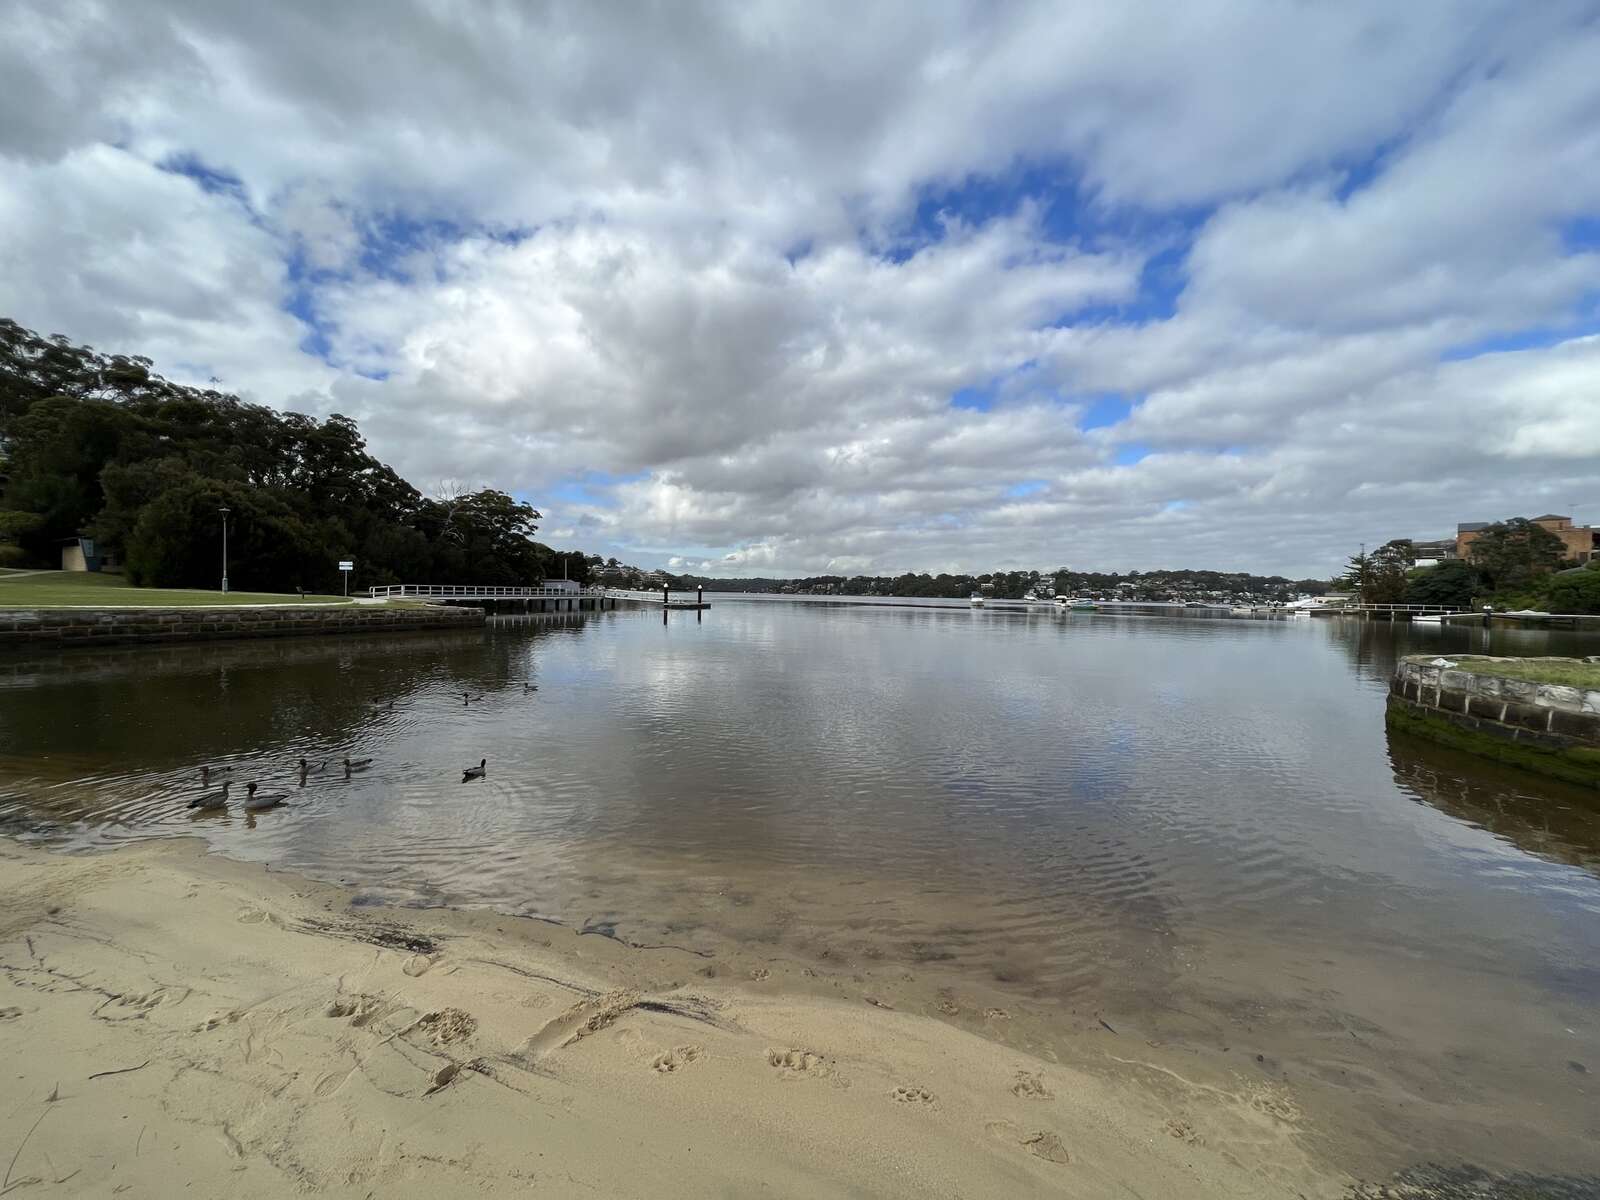
All the waterways monitored in the Bayside area are estuaries so they are well flushed by sea water. The Georges River mouth is consistently 'Excellent'. Although there is less tidal flushing, in the narrower Tonbridge Creek, it still had ‘Good’ water quality. Scott Park saltmarsh had ‘Poor’ water quality. For a detailed map indicating river health grades in this area, see Georges River Health Report Card 2021-2022. Go to Bayside Council's website for further information about Bayside waterways.
Campbelltown
Subcatchments: Lower Freshwater, Upper Freshwater, Bunbury Curran Creek, O’Hares Creek
Campbelltown has mixed landuse. From the highly urbanised areas of the Bunbury Curran Creek subcatchment to the bushland areas of the Lower Freshwater subcatchment so mixed results are expected. Campbelltown was generally ‘Good’ with a slight decreased grade in the Lower Freshwater region. The highly urbanised Bunbury Curran subcatchment was ‘Poor'. For a detailed map indicating river health grades in this area, see Georges River Health Report Card 2021-2022. Go to Campbelltown City Council's website for more information about waterways in the Campbelltown LGA.
Canterbury-Bankstown
Georges River Estuary and Mid Estuary and Mill Creek subcatchment
Canterbury-Bankstown is a highly urbanised area and as such ‘Poor’ water quality results are expected. The estuary water quality remains ‘Good’ or ‘Excellent’ at Mill Creek, Salt Pan Creek and Little Salt Pan Creek. The tides flush these reaches of the creek creating a healthy ecosystem. However, the freshwater waterway Little Salt Pan Creek was ‘Poor’. For a detailed map indicating river health grades in this area, see Georges River Health Report Card 2021-2022. Go to City of Canterbury Bankstown's website for more information about waterways in the Canterbury-Bankstown LGA.
Fairfield
Georges River Estuary and Prospect Creek subcatchment
Fairfield’s waterways have made a dramatic improvement. With grades improving from ‘Poor’ to ‘Fair’. Despite the urbanisation of Orphan School Creek and Prospect Creek, their grades have improved. The effort of Council to improve these waterways may have led to the water quality improvements. For a detailed map indicating river health grades in this area, see Georges River Health Report Card 2021-2022. Go to Fairfield City Council's website for more information about waterways in the Fairfield LGA.

Georges River
Georges River Estuary and Lower Estuary subcatchment
Georges River LGA overall had ‘Poor’ freshwater quality while the estuarine waterways had mixed results ranging from ‘Poor’ to ‘Excellent’. The ‘Poor’ estuarine results were caused by high turbidity perhaps affected by increased rainfall this year. For a detailed map indicating river health grades in this area, see Georges River Health Report Card 2021-2022. Go to Georges River Council's website for more information about waterways in the Georges River LGA.
Liverpool
Georges River Estuary and Cabramatta Creek subcatchment
Liverpool is a highly urbanised area and as such ‘Poor’ water quality results are expected. However, Liverpool’s water quality grades remain stable and overall, the water quality is ‘Fair’. For a detailed map indicating river health grades in this area, see Georges River Health Report Card 2021-2022. Go to Liverpool City Council's website for more information about waterways in the Liverpool LGA.
Sutherland Shire
Georges River Estuary, Mill Creek and Woronora River subcatchments
Sutherland Shire encompasses a huge area of bushland, so it usually has excellent water quality. However, the latest results had a decrease in water quality from ‘Excellent’ to ‘Good’. This may reflect the increase in rainfall events causing changes in the ecology. The estuarine results were ‘Fair’. For a detailed map indicating river health grades in this area see Georges River Health Report Card 2021-2022. Go to Sutherland Shire Council's website for more information about waterways in the LGA.

Wollondilly Shire
Subcatchments: Upper Freshwater and O’Hares Creek
Wollondilly has few urban areas within the Georges River catchment, however the vast majority is covered by bushland. Wollondilly’s water quality remains ‘Good’. With some areas, like Georges River at Kennedy Grove and Brennans Creek being ‘Fair’. For a detailed map indicating river health grades in this area, see Georges River Health Report Card 2021-2022. Go to Wollondilly Shire Council's website for more information about waterways in the Wollondilly LGA.
Read the full report
The Georges River Report Card 2021-2022 presents the findings of 12 months of data collection based on monitoring that has taken place across the Georges River catchment, in both freshwater creeks and the Georges River estuary which feeds into Botany Bay. Download the report.